Follow us on


 Protected
Protected
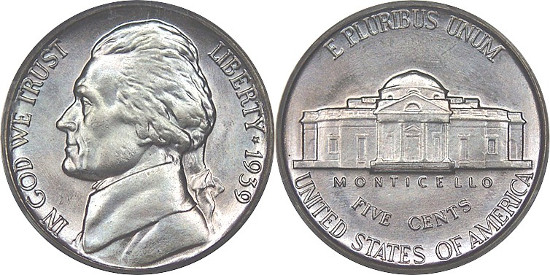
JEFFERSON NICKEL MINTAGE
| Year & Mint | Mintage | Proof Mintage |
|---|---|---|
| 1938 | 19,496,000 | 19,365 |
| 1938-D | 5,376,000 | 0 |
| 1938-S | 4,105,000 | 0 |
| 1939 | 120,615,000 | 12,535 |
| 1939-D | 3,514,000 | 0 |
| 1939-S | 6,630,000 | 0 |
| 1940 | 176,485,000 | 14,158 |
| 1940-D | 43,540,000 | 0 |
| 1940-S | 39,690,000 | 0 |
| 1941 | 203,265,000 | 18,720 |
| 1941-D | 53,432,000 | 0 |
| 1941-S | 43,445,000 | 0 |
| 1942 | 49,789,000 | 29,600 |
| 1942-D | 13,938,000 | 0 |
| 1942-P | 57,873,000 | 27,600 |
| 1942-S | 32,900,000 | 0 |
| 1943-P | 271,165,000 | 0 |
| 1943-D | 15,294,000 | 0 |
| 1943-S | 104,060,000 | 0 |
| 1944-P | 119,150,000 | 0 |
| 1944-D | 32,309,000 | 0 |
| 1944-S | 21,640,000 | 0 |
| 1945-P | 119,408,100 | 0 |
| 1945-D | 37,158,000 | 0 |
| 1945-S | 58,939,000 | 0 |
| 1946 | 161,116,000 | 0 |
| 1946-D | 45,292,200 | 0 |
| 1946-S | 13,560,000 | 0 |
| 1947 | 95,000,000 | 0 |
| 1947-D | 37,822,000 | 0 |
| 1947-S | 24,720,000 | 0 |
| 1948 | 89,348,000 | 0 |
| 1948-D | 44,734,000 | 0 |
| 1948-S | 11,300,000 | 0 |
| 1949 | 60,652,000 | 0 |
| 1949-D | 36,498,000 | 0 |
| 1949-S | 9,716,000 | 0 |
| 1950 | 9,796,000 | 51,386 |
| 1950-D | 2,630,030 | 0 |
| 1951 | 28,552,000 | 57,500 |
| 1951-D | 20,460,000 | 0 |
| 1951-S | 7,776,000 | 0 |
| 1952 | 63,988,000 | 81,980 |
| 1952-D | 30,638,000 | 0 |
| 1952-S | 20,572,000 | 0 |
| 1953 | 46,644,000 | 128,800 |
| 1953-D | 59,878,600 | 0 |
| 1953-S | 19,210,900 | 0 |
| 1954 | 47,684,050 | 233,300 |
| 1954-D | 117,183,060 | 0 |
| 1954-S | 29,384,000 | 0 |
| 1955 | 7,888,000 | 378,200 |
| 1955-D | 74,464,100 | 0 |
| 1956 | 35,216,000 | 669,384 |
| 1956-D | 67,222,940 | 0 |
| 1957 | 38,408,000 | 1,247,952 |
| 1957-D | 136,828,900 | 0 |
| 1958 | 17,088,000 | 875,652 |
| 1958-D | 168,249,120 | 0 |
| 1959 | 27,248,000 | 1,149,291 |
| 1959-D | 160,738,240 | 0 |
| 1960 | 55,416,000 | 1,691,602 |
| 1960-D | 192,582,180 | 0 |
| 1961 | 73,640,100 | 3,028,144 |
| 1961-D | 229,342,760 | 0 |
| 1962 | 97,384,000 | 3,218,019 |
| 1962-D | 280,195,720 | 0 |
| 1963 | 178,851,645 | 3,075,645 |
| 1963-D | 276,829,460 | 0 |
| 1964 | 1,028,622,762 | 3,950,762 |
| 1964-D | 1,787,297,160 | 0 |
| 1965 | 136,131,380 | 2,360,000* |
| 1966 | 156,208,283 | 2,261,583* |
| 1967 | 107,325,800 | 1,863,344* |
| 1968-D | 91,227,880 | 0 |
| 1968-S | 100,396,004 | 3,041,506 |
| 1969-D | 202,807,500 | 0 |
| 1969-S | 120,075,000 | 2,934,631 |
| 1970-D | 515,485,380 | 0 |
| 1970-S | 238,832,004 | 2,632,810 |
| 1971 | 106,884,000 | 0 |
| 1971-D | 316,144,800 | 0 |
| 1971-S | 0 | 3,220,733 |
| 1972 | 202,036,000 | 0 |
| 1972-D | 351,694,600 | 0 |
| 1972-S | 0 | 3,260,996 |
| 1973 | 384,396,000 | 0 |
| 1973-D | 361,405,000 | 0 |
| 1973-S | 0 | 2,760,339 |
| 1974 | 601,752,000 | 0 |
| 1974-D | 277,373,000 | 0 |
| 1974-S | 0 | 2,612,568 |
| 1975 | 181,772,000 | 0 |
| 1975-D | 401,875,300 | 0 |
| 1975-S | 0 | 2,845,450 |
| 1976 | 367,124,000 | 0 |
| 1976-D | 563,964,147 | 0 |
| 1976-S | 0 | 4,149,730 |
| 1977 | 585,376,000 | 0 |
| 1977-D | 297,313,422 | 0 |
| 1977-S | 0 | 3,251,152 |
| 1978 | 391,308,000 | 0 |
| 1978-D | 313,092,780 | 0 |
| 1978-S | 0 | 3,127,781 |
| 1979 | 463,188,000 | 0 |
| 1979-D | 325,867,672 | 0 |
| 1979-S | 0 | 3,677,175 |
| 1980-P | 593,004,000 | 0 |
| 1980-D | 502,323,448 | 0 |
| 1980-S | 0 | 3,554,806 |
| 1981-P | 657,504,000 | 0 |
| 1981-D | 364,801,843 | 0 |
| 1981-S | 0 | 4,063,083 |
| 1982-P | 292,355,000 | 0 |
| 1982-D | 373,726,544 | 0 |
| 1982-S | 3,857,479 | 0 |
| 1983-P | 561,615,000 | 0 |
| 1983-D | 536,726,276 | 0 |
| 1983-S | 0 | 3,279,126 |
| 1984-P | 746,769,000 | 0 |
| 1984-D | 517,675,146 | 0 |
| 1984-S | 0 | 3,065,110 |
| 1985-P | 647,114,962 | 0 |
| 1985-D | 459,747,446 | 0 |
| 1985-S | 0 | 3,362,821 |
| 1986-P | 536,883,483 | 0 |
| 1986-D | 361,819,140 | 0 |
| 1986-S | 0 | 3,010,497 |
| 1987-P | 371,499,481 | 0 |
| 1987-D | 410,590,604 | 0 |
| 1987-S | 0 | 4,227,728 |
| 1988-P | 771,360,000 | 0 |
| 1988-D | 663,771,652 | 0 |
| 1988-S | 0 | 3,262,948 |
| 1989-P | 898,812,000 | 0 |
| 1989-D | 570,842,474 | |
| 1989-S | 0 | 3,220,194 |
| 1990-P | 661,636,000 | 0 |
| 1990-D | 663,938,503 | 0 |
| 1990-S | 0 | 3,299,559 |
| 1991-P | 614,104,000 | 0 |
| 1991-D | 436,496,678 | 0 |
| 1991-S | 0 | 2,867,787 |
| 1992-P | 399,552,000 | 0 |
| 1992-D | 450,565,113 | 0 |
| 1992-S | 0 | 4,176,560 |
| 1993-P | 412,076,000 | 0 |
| 1993-D | 406,084,135 | 0 |
| 1993-S | 0 | 3,394,792 |
| 1994-P | 722,160,000 | 0 |
| 1994-P Matte | 167,703 | 0 |
| 1994-D | 715,762,110 | 0 |
| 1994-S | 0 | 3,269,923 |
| 1995-P | 774,156,000 | 0 |
| 1995-D | 888,112,000 | 0 |
| 1995-S | 0 | 2,797,481 |
| 1996-P | 829,332,000 | 0 |
| 1996-D | 817,736,000 | 0 |
| 1996-S | 0 | 2,525,625 |
| 1997-P | 470,972,000 | 0 |
| 1997-P Matte | 25,000 | 0 |
| 1997-D | 466,640,000 | 0 |
| 1997-S | 0 | 2,796,678 |
| 1998-P | 688,292,000 | 0 |
| 1998-D | 635,380,000 | 0 |
| 1998-S | 0 | 2,086,507 |
| 1999-P | 1,212,000,000 | 0 |
| 1999-D | 1,066,720,000 | 0 |
| 1999-S | 0 | 2,543,401 |
| 2000-P | 846,240,000 | 0 |
| 2000-D | 1,509,520,000 | 0 |
| 2000-S | 0 | 3,082,483 |
| 2001-P | 675,704,000 | 0 |
| 2001-D | 627,680,000 | 0 |
| 2001-S | 0 | 2,294,043 |
| 2002-P | 529,280,000 | 0 |
| 2002-D | 691,200,000 | 0 |
| 2002-S | 0 | 2,277,720 |
| 2003-P | 441,840,000 | 0 |
| 2003-D | 383,040,000 | 0 |
| 2003-S | 0 | 3,298,439 |
| 2004-P | 361,440,000 | 0 |
| 2004-D | 372,000,000 | 0 |
| 2004-S | 0 | 2,965,422 |
| 2004-P | 366,720,000 | 0 |
| 2004-D | 344,880,000 | 0 |
| 2004-S | 0 | 2,965,422 |
| 2005-P | 448,320,000 | 0 |
| 2005-D | 487,680,000 | 0 |
| 2005-S | 0 | 3,344,679 |
| 2005-P | 394,080,000 | 0 |
| 2005-D | 411,120,000 | 0 |
| 2005-S | 0 | 3,344,679 |
| 2006-P | 693,120,000 | 0 |
| 2006-D | 809,280,000 | 0 |
| 2006-S | 0 | 3,054,436 |
| 2007-P | 523,680,000 | 0 |
| 2007-D | 591,600,000 | 0 |
| 2007-S | 0 | 2,259,847 |
| 2008-P | 287,760,000 | 0 |
| 2008-D | 352,800,000 | 0 |
| 2008-S | 0 | 1,998,108 |
| 2009-P | 46,800,000 | 0 |
| 2009-D | 39,840,000 | 0 |
| 2009-S | 0 | ? |
| 2010-P | 260,640,000 | 0 |
| 2010-D | 229,920,000 | 0 |
| 2010-S | 0 | ? |
| 2011-P | 450,000,000 | 0 |
| 2011-D | 540,240,000 | 0 |
| 2011-S | 0 | ? |
| 2012-P | 464,640,000 | 0 |
| 2012-D | 558,960,000 | 0 |
| 2012-S | 0 | ? |
| 2013-P | ? | 0 |
| 2013-D | ? | 0 |
| 2013-S | 0 | ? |